国际肿瘤学杂志 ›› 2025, Vol. 52 ›› Issue (7): 401-408.doi: 10.3760/cma.j.cn371439-20250123-00070

• 论著 • 上一篇    下一篇

双能CT虚拟平扫图像代替真实平扫图像在光子与质子放疗剂量计算中的可行性研究

刘琦1, 曲国斌2, 朱健1,3, 吴凡4()   

  1. 1山东第一医科大学附属肿瘤医院放射物理技术科,济南 250117
    2山东省烟台业达医院影像科,烟台 265500
    3山东省医药卫生儿童肿瘤精确放疗重点实验室(山东省肿瘤医院),济南 250117
    4山东第一医科大学附属职业病医院特检科,济南 250002
  • 收稿日期:2025-01-23 修回日期:2025-06-16 出版日期:2025-07-08 发布日期:2025-07-23
  • 通讯作者: 吴凡 E-mail:13791080608@139.com
  • 基金资助:
    国家科技重大专项(2024ZD0519901);国家自然科学基金(82172072);山东省重点研发计划(2024CXPT084)

Feasibility study of using dual-energy CT virtual non-contrast images to replace true non-contrast images in photon and proton radiotherapy dose calculations

Liu Qi1, Qu Guobin2, Zhu Jian1,3, Wu Fan4()   

  1. 1Department of Radiation Oncology Physics,Cancer Hospital of Shandong First Medical University,Jinan 250117,China
    2Department of Radiology,Yantai Yeda Hospital,Yantai 265500,China
    3Shandong Provincial Key Medical and Health Laboratory of Pediatric Cancer Precision Radiotherapy (Shandong Cancer Hospital),Jinan 250117,China
    4Department of Special Examination,Occupational Diseases Hospital of Shandong First Medical University,Jinan 250002,China
  • Received:2025-01-23 Revised:2025-06-16 Online:2025-07-08 Published:2025-07-23
  • Contact: Wu Fan E-mail:13791080608@139.com
  • Supported by:
    National Science and Technology Major Project of China(2024ZD0519901);National Natural Science Foundation of China(82172072);Key R&D Program of Shandong Province,China(2024CXPT084)

摘要:

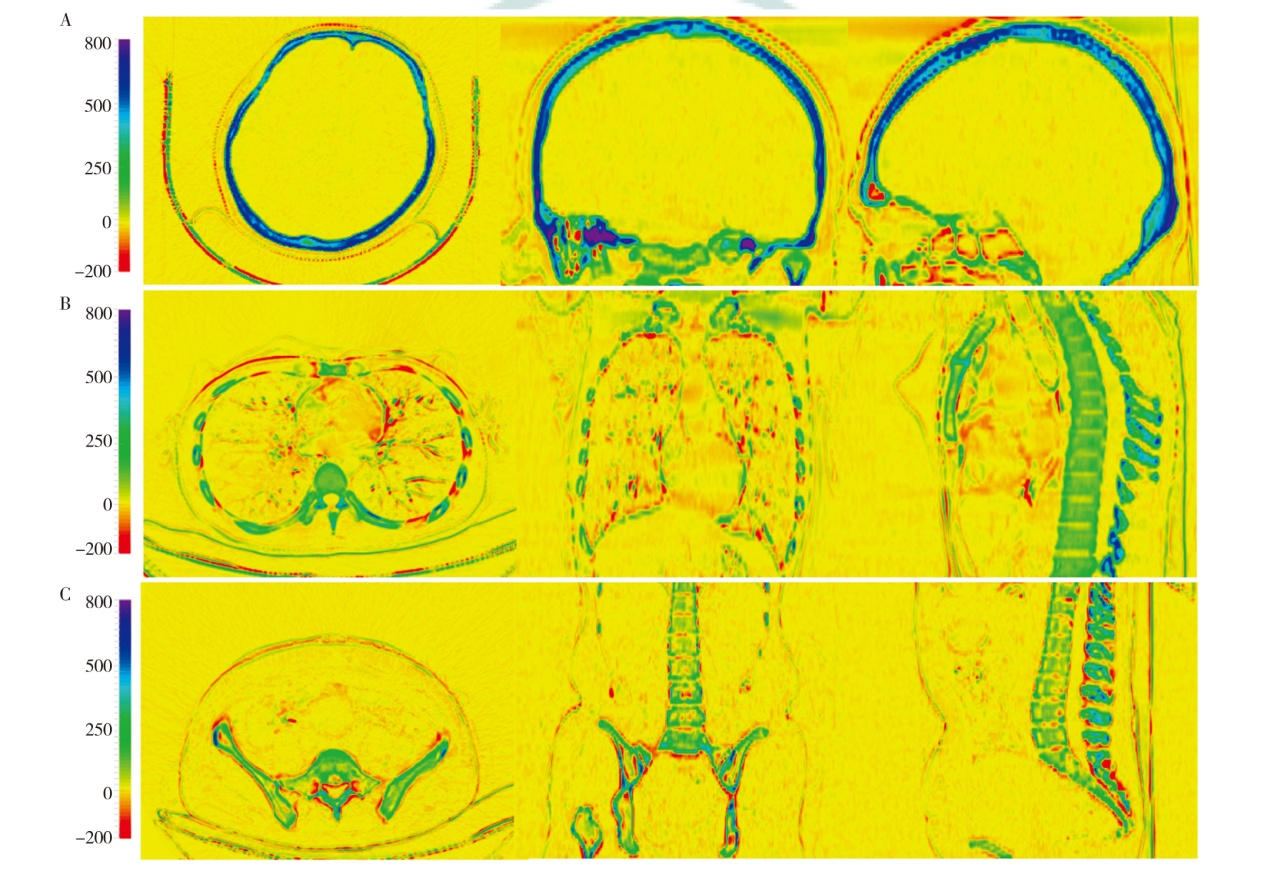
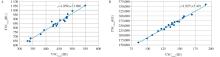
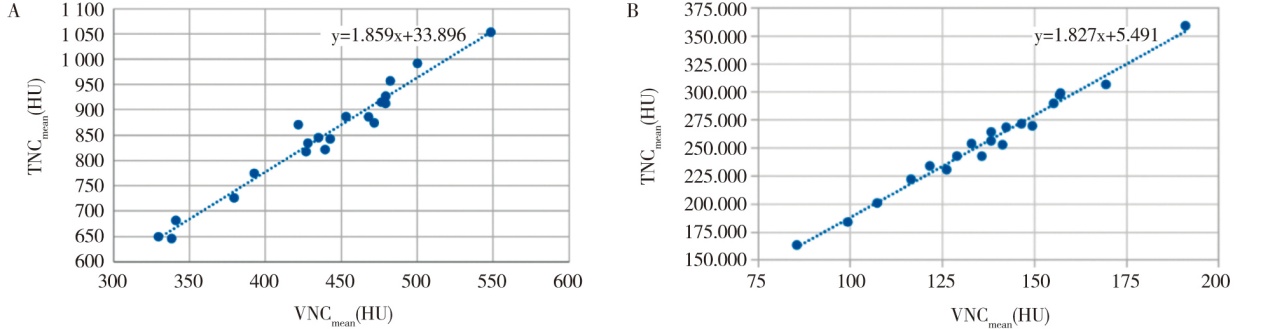
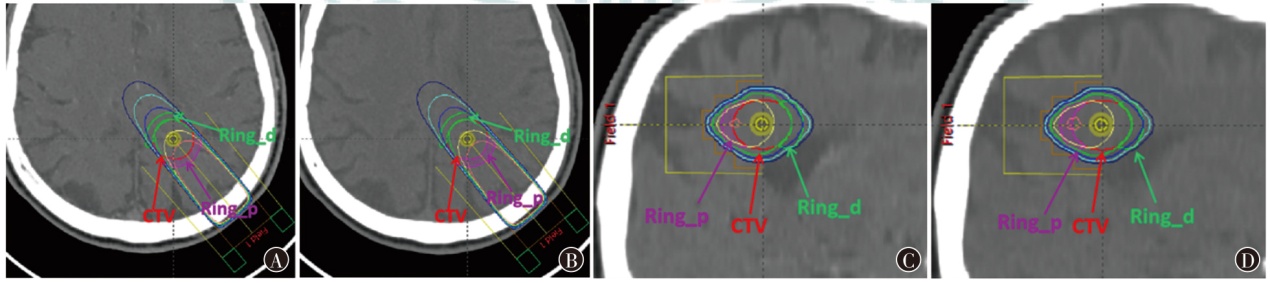
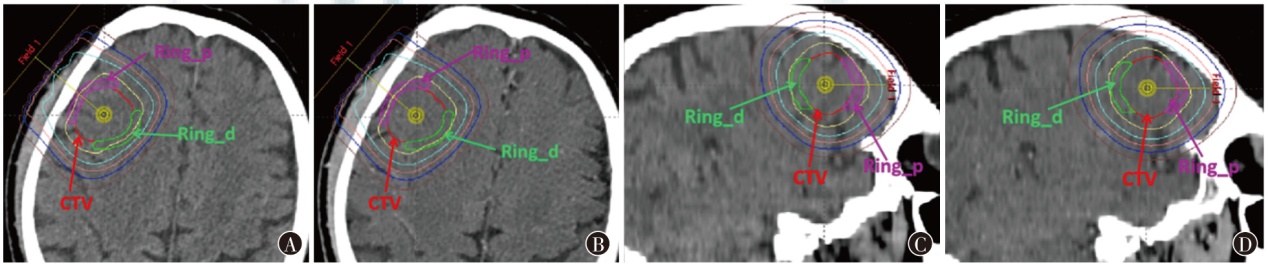
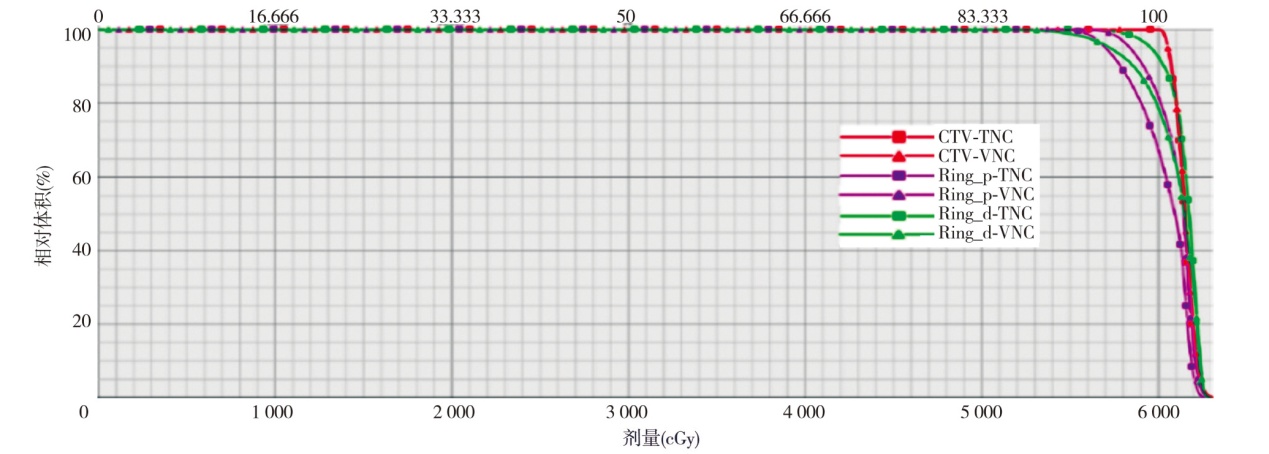
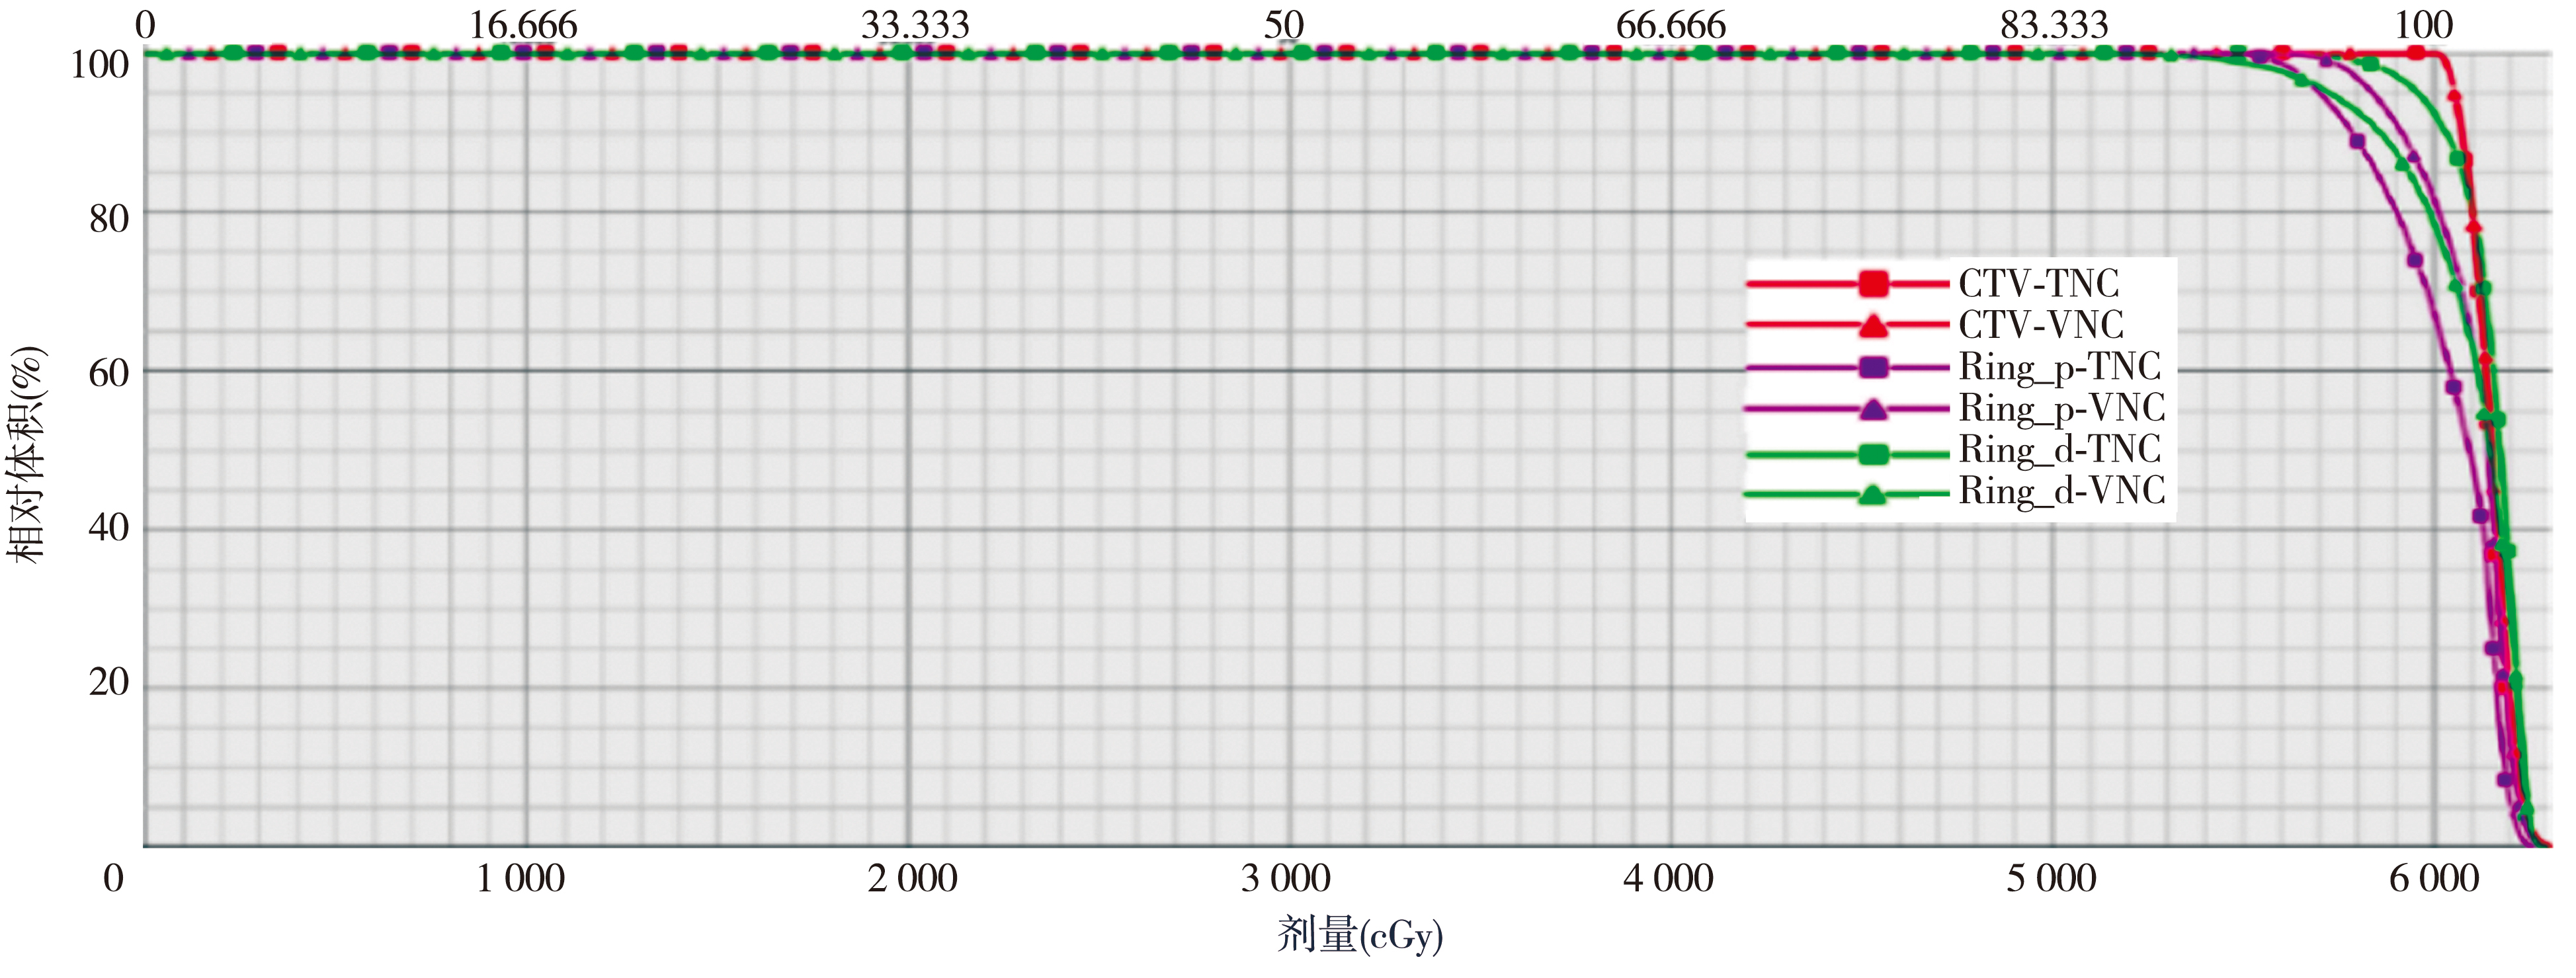
目的 系统评估双能CT(DECT)中虚拟平扫(VNC)图像与真实平扫(TNC)图像在CT值上的差异,并验证VNC图像在光子、质子放疗计划剂量计算中替代TNC图像的可行性。方法 回顾性分析2022年2月至2023年5月于山东第一医科大学附属肿瘤医院接受DECT检查的40例实体瘤患者(头颅20例,胸、腹部各10例)的影像数据。对VNC与TNC图像逐层配准,并比较不同解剖结构的CT值差异,采用Pearson相关分析评估VNC与TNC图像中不同解剖结构CT值的相关性。对差异显著的结构采用最小二乘法建立回归模型(TNC=βVNC+α)。在Eclipse 15.5放疗计划系统中分别设计基于TNC图像与VNC图像的光子与质子放疗计划,以及基于回归模型校正后VNC图像的质子放疗计划,评估两种图像放疗计划的剂量差异。为评估临床靶区(CTV)邻近区域的剂量变化,于CTV所在轴向最大层面分别向前(头侧)和向后(足侧)方向构建厚度为2 mm的环形参照结构,分别命名为Ring_p与Ring_d。结果 VNC与TNC图像的CT值差异主要集中于骨性结构,20例颅脑肿瘤患者的颅骨CT值差异为(409.07±53.38)HU(t=13.88,P<0.001),10例胸部和10例腹部肿瘤患者的脊椎骨CT值差异为(118.66±20.90)HU(t=10.43,P<0.001)。TNC与VNC图像的颅骨(r=0.98,P<0.001)和脊椎骨(r=0.99,P<0.001)CT值均高度相关,分别建立回归模型为:TNC=1.859×VNC+33.896和TNC=1.827×VNC+5.491。基于TNC图像与VNC图像设计的光子放疗计划中,CTV的Dmean分别为(60.00±0.00)与(60.00±0.00)Gy,Ring_p的Dmean分别为(61.17±1.69)与(61.01±1.67)Gy,Ring_d的Dmean分别为(55.26±2.06)与(55.20±1.94)Gy,两组间Dmean的相对剂量差分别为0(t<0.01,P>0.999)、0.33%(t=0.30,P=0.766)和0.19%(t=0.07,P=0.947),差异均无统计学意义。基于TNC图像与VNC图像设计的质子放疗计划中,CTV的Dmean分别为(61.73±0.32)与(61.67±0.26)Gy(RBE),Ring_p的Dmean分别为(61.19±0.44)与(60.53±1.22)Gy(RBE),Ring_d的Dmean分别为(60.97±0.67)与(59.80±4.26)Gy(RBE),两组间Dmean的相对剂量差分别为0.24%(t=0.63,P=0.530)、1.80%(t=1.45,P=0.156)、3.56%(t=2.26,P=0.030),其中Ring_d区域差异有统计学意义。基于校正后VNC图像设计的质子放疗计划中,CTV的Dmean为(61.75±0.32)Gy(RBE),Ring_p的Dmean为(61.43±0.71)Gy(RBE),Ring_d的Dmean为(59.96±2.80)Gy(RBE),基于TNC与校正后VNC图像间Dmean的相对剂量差分别为0.16%(t=0.19,P=0.850)、0.76%(t=1.32,P=0.196)和2.22%(t=1.93,P=0.061),差异均无统计学意义。结论 DECT中VNC与TNC图像的CT值差异主要存在于骨性结构,尤其是颅骨和脊椎骨。对于颅脑肿瘤患者,VNC图像可以直接用于光子放疗计划;而在质子放疗中,VNC图像经回归模型校正后,可有效替代TNC图像用于放疗计划剂量计算。

关键词: 放射疗法, 质子疗法, 放射治疗剂量, 双能CT, 虚拟平扫, 真实平扫

Abstract:

Objective To systematically evaluate the differences in CT values between virtual non-contrast (VNC) images and true non-contrast (TNC) images generated from dual-energy CT (DECT),and to validate the feasibility of VNC images replacing TNC images in dose calculations for photon and proton radiotherapy plans. Methods A retrospective analysis was conducted on the imaging data of 40 patients with solid tumors (20 cranial,10 thoracic and 10 abdominal cases) who underwent DECT scans at Cancer Hospital of Shandong First Medical University from February 2022 to May 2023. VNC and TNC images were registered slice-by-slice. The differences in CT values of anatomical structures were compared,and Pearson correlation analysis was used to evaluate the correlation of CT values of different anatomical structures in VNC and TNC images. For structures with significant differences,linear regression models (TNC=β×VNC+α) were established using the least squares method. In the Varian Eclipse 15.5 treatment planning system,photon and proton radiotherapy plans based on TNC images and VNC images,as well as the proton radiotherapy plan based on the VNC images corrected by the regression models,were respectively designed. Dose differences of radiotherapy plans designed based on the two images were evaluated. To evaluate dose variations in regions adjacent to the clinical target volume (CTV),two 2-mm-thick annular reference structures were generated on the axial slice containing the largest cross-section of the CTV,extending cranially and caudally from the CTV. These structures were designated as Ring_p and Ring_d,respectively. Results The differences in CT values between VNC and TNC images were mainly concentrated in the bony structure. The CT values difference between TNC and VNC images was (409.07±53.38) HU for the skull in 20 cranial tumor patients (t=13.88,P<0.001),and (118.66±20.90) HU for the vertebral bone in 10 thoracic and 10 abdominal tumor patients (t=10.43,P<0.001). The CT values of the skull and spine showed high correlation between TNC and VNC images (r=0.98,P<0.001; r=0.99,P<0.001). The regression models established respectively were: TNC=1.859×VNC+33.896 (skull),and TNC=1.827×VNC+5.491 (spine). For photon radiotherapy plans based on TNC and VNC images,the Dmean of the CTV were (60.00±0.00) and (60.00±0.00) Gy respectively,with Dmean of Ring_p were (61.17±1.69) and (61.01±1.67) Gy,and Ring_d were (55.26±2.06) and (55.20±1.94) Gy,respectively. The relative dose differences in Dmean between the two image types were 0 (t<0.01,P>0.999),0.33% (t=0.30,P=0.766),and 0.19% (t=0.07,P=0.947),all with no statistically significant differences. For proton radiotherapy plans based on TNC and VNC images,the Dmean of the CTV were (61.73±0.32) and (61.67±0.26) Gy(RBE),respectively,with Dmean of Ring_p were (61.19±0.44) and (60.53±1.22) Gy(RBE),and Ring_d were (60.97±0.67) and (59.80±4.26) Gy(RBE),respectively. The relative dose differences in Dmean between the two image types were 0.24% (t=0.63,P=0.530),1.80% (t=1.45,P=0.156),and 3.56% (t=2.26,P=0.030),with a statistically significant difference in the Ring_d region. In the proton radiotherapy plan designed based on the corrected VNC images,the Dmean of the CTV was (61.75±0.32) Gy(RBE),Ring_p was (61.43±0.71) Gy(RBE),and Ring_d was (59.96±2.80) Gy(RBE). The relative dose differences in Dmean between TNC images and corrected VNC images were 0.16% (t=0.19,P=0.850),0.76% (t=1.32,P=0.196),and 2.22% (t=1.93,P=0.061),respectively,with no statistically significant differences. Conclusions The differences in CT values between VNC and TNC images in DECT mainly exist in bony structures,particularly in the skull and vertebrae. For patients with cranial tumors,VNC images can be directly used in photon radiotherapy planning. In contrast,for proton therapy,after being corrected by the regression model,VNC images can effectively replace TNC images for the dose calculations of radiotherapy plan.

Key words: Radiotherapy, Proton therapy, Radiotherapy dosage, Dual-energy CT, Virtual non-contrast scan, True non-contrast scan